-p-1080.jpg)


.JPG)
We calculate the surges in new COVID-19 cases for 54 African countries from the beginning of the pandemic onward using the Our World in Data (OWID) complete COVID-19 dataset.
Peter van Heusden and Dirk Meerkotter tell us how the COVID-19 resurgence Map was created.
Background
The idea for this data dashboard originated with Peter van Heusden, a bioinformatician and Senior Systems Developer at the South African National Bioinformatics Institute (SANBI); he had the idea of tracking or assessing emerging and declining risk across the continent. In exploring the concept, we found several issues conceptualising this dashboard as tracking or accessing changes in risk;
- We found ‘risk’ too loaded with meaning and too prescriptive.
- To measure risk, we need to measure more than the increase or decrease in cases (which is the data we had at the time).
The initial OWID COVID-19 dataset interrogation was done by Dirk Meerkotter and Peter van Heusden in a Jupyter Notebook using Python and Pandas. Dirk advises that “Jupyter is a great tool for data science as it allows on the fly interrogation, extraction and transformation of datasets.” Dirk and Peter began overlaying surges in new COVID-19 cases with different metrics to discern correlations. Ultimately, they decided that all the different metrics they had in the dataset should be available to the user to overlay with surges in new case data; this enables journalists to explore and find their own stories through the dashboard.
They decided on a formula to track the changes in new COVID-19 cases because the daily data had unexplained variability that obscured the meaningful data. Therefore, Dirk took a seven-day rolling window of the data to measure the percentage change in the number of new confirmed cases in that period relative to the previous seven days throughout the pandemic. This seven-day rolling view of the data is used in the resurgence dashboard - in the map and the leaderboard.
While this view of the data removes some of the noise associated with the daily data, the percentage change of new COVID-19 cases, as we have calculated, can be problematic.
Dirk notes, “the problem I saw with the percentage approach is that it is relative to the week before - so even if cases are on the decrease - i.e. turning blue- that does not mean the situation is good or low. That is why I added the Absolute view taking just the sum value, which clearly shows the wave pattern even on the map.”
Where do we get our data from?
We source our data from Our World in Data (OWID), an online publication that provides research and data on global challenges. In addition, they source their COVID-19 vaccine data from the most recent official data released by governments and health ministries globally.
Why is this a reliable data source?
Africa Data Hub is dependent on OWID to collect and collate the data. We rely on their commitment and willingness to be transparent and their credibility. We believe that they are credible based on their data collection from official sources, scientific methods, and level of transparency.
Is the data open?
Yes, Our World In Data is open. Their data and supporting resources serve as a public good. The raw data is updated daily and available for download in CSV format.
Our data visualisations and copy are licensed under a Creative Commons Attribution 4.0 International License and freely available for use and embedding in others’ work. Users are encouraged to explore the data, download the resources, leave feedback, and contact us for more information.
How is the data collected?
OWID has dedicated teams of people collecting COVID-19 data from official reports and sources, including
- The African Centers for Disease Control and Prevention (Africa CDC)
- National Health Ministries
- United Nations
- World Bank
- Global Burden of Disease
- Blavatnik School of Government
You can find more information about the OWID data sources for each country here.
Is this sensitive data that requires approval before sharing?
OWID is a public resource, and their data is freely downloadable, and there is the option to do that on this dashboard. In addition, we download the data as CSV files daily. Therefore, visualisations and data can be shared with the corresponding attribution.
How current is the data used in the resurgence dashboard?
The data is updated daily; this enables the resurgence dashboard to be up-to-date with OWID datasets. We have noticed a 1-2 days lag after governments and health ministries release official data.
How did we process the OWID data?
We created and employed a formula to track the changes in new COVID-19 cases. We did this because the daily data had unexplained variability that obscured the meaningful data. This statistical approach is called data smoothing and is used to eliminate outliers from datasets to make the patterns more transparent.
What tools were used?
The initial OWID COVID-19 dataset interrogation was done in a Jupyter Notebook using Python and Pandas as this enables a quick interrogation, extraction and transformation of datasets. The web application of the Resurgence Dashboard is built with a React framework.
How were the indicators chosen?
We chose the indicators based on the most widely and commonly reported data in Africa. The data selected has been highly curated and explained to avoid misunderstanding and misusing data.
How did we decide on how to represent the data?
We selected data visualisations that lent themselves to the data and what story we wanted to tell with the data; for example, geographical data lends itself to being represented in a map.
What should I look out for when using this dashboard?
- Data is available at the country level for the continent because there are gaps in the sub-national level data.
- We flag problematic data with the alert badge (!)
- When writing this article, we flagged data when there is no change in case numbers over a few days.
- These flags will, in the future, include watching for unrealistic percentage changes.
What combination of this data helps tell a compelling story?
The data is often surprising, and this dashboard simplifies looking for interesting trends. Data smoothing can be defined as a statistical approach to eliminating outliers from datasets to make the patterns more transparent. However, looking at unsmoothed data can show how a country reports its COVID-19 statistics, as surge data can indicate data dumping, gaps in data or just an increase in testing. Showing the trends in COVID-19 data or looking into the quality of the data can both tell a compelling story.
OWID has up-to-date Testing Data for less than half of Africa
Testing for COVID-19 is critical for measuring and tracking the resurgence of COVID-19. Positive COVID-19 tests equal the number of new confirmed COVID-19 cases, but there are likely to be many more unconfirmed cases of COVID-19 because not everyone with symptoms is tested. And not all test results are reported. OWID only includes PCR and antigen test results as these are reliable indicators of active cases at a given time. Antibody tests are less useful because a positive result would mean that the person has had COVID-19 before, but they are not necessarily infectious at the time of testing.
Testing data is used to calculate five indicators in the resurgence map related to new confirmed cases and four indicators related to testing and positivity. Testing for COVID-19 is a significant cost for healthcare budgets.
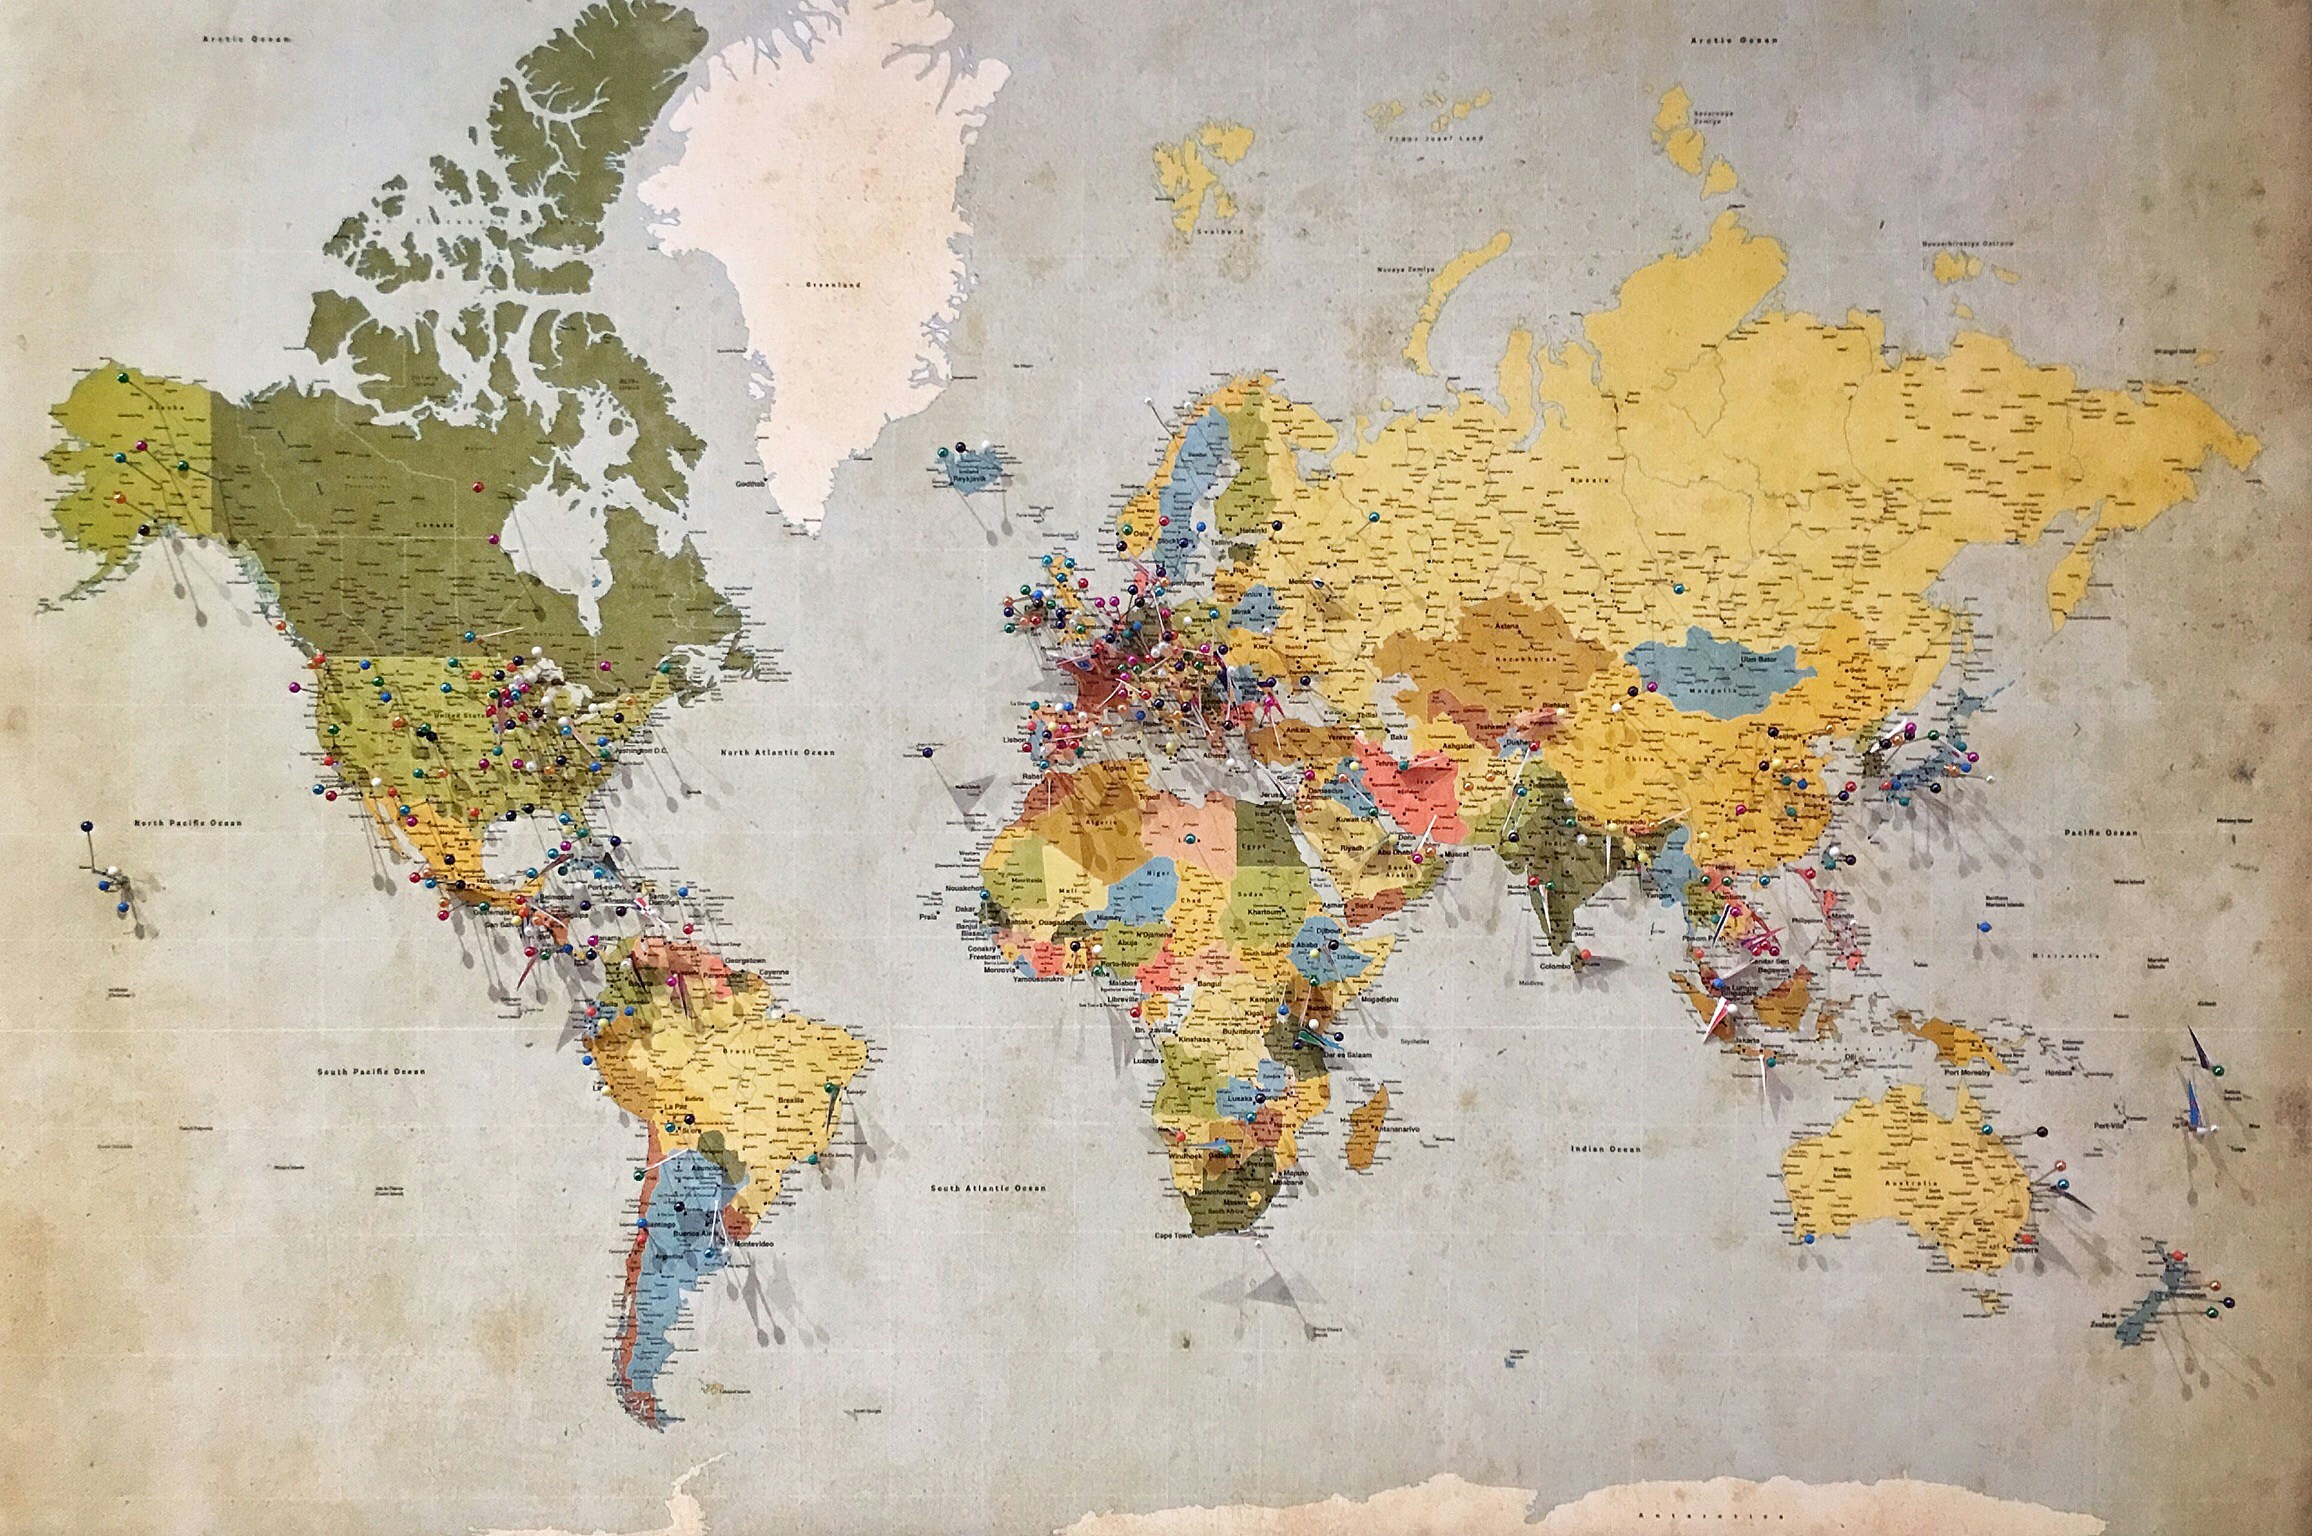
“While poorer countries such as Cote d’Ivoire and Nigeria have done only a few tests per thousand people, richer countries like Australia, Denmark, and the United Arab Emirates have done more tests than people in the country.”
(OWID website See more details here.)
The map above shows how many African countries do not provide testing data on which OWID can report. There are also significant gaps in the data collected and published. These gaps in data are highlighted with an exclamation mark in the ADH Resurgence Map. The leaderboard view of the resurgence map was designed to show at a glance which countries in Africa are experiencing a sudden increase in new COVID-19 cases. But because there are significant gaps in the data and some counties share their data infrequently, the leader board highlights which countries have suddenly uploaded data after a long period of not uploading any data.
For example, where an increase in new confirmed COVID-19 cases exceeds 200%, there was likely a sudden data dump. As a result, the top ten and bottom 43 - 53 countries on the leaderboard include countries where significant gaps in the data are identified.
The infrequency of data uploads per country is best seen when you overlay new_confirmed_cases. See, for example, the graph of Guinea-Bissau below. It shows new confirmed cases smoothed (represented by the line) compared to new confirmed cases in bars. We suggest that you look into whether the sudden increase in confirmed cases reflects a surge in cases or a data dump by the institutions collecting test results in that country.

New confirmed cases smoothed (represented by the line) compared to new confirmed cases in Guinea-Bissau.
We have provided the OWID definitions for each indicator on the dashboard as per the OWID descriptions available in gitbook here. The data sources for each indicator are also given here. The additional explainers were researched and written by ADH with references where relevant.
For more detail about OWID data and the changelog, see:
https://github.com/owid/covid-19-data/tree/master/public/data/
Preferred citation: African Data Hub. (2021). Resurgence Dashboard. [online] https://resurgence.africadatahub.org