
-p-1080.jpg)

Every two years, the United Nations Development Programme (UNDP) publishes an update to a repository of statistical indicators used to calculate the Human Development Index (HDI).
These indicators are derived from multiple datasets to provide a simple way of comparing development in countries over time. The next update is due to be released on 8 September 2022, and will cover a timeframe that includes the peak of the COVID-19 pandemic. Given its importance as an observational dataset, we thought it would be a good idea to take a look at the HDI, to help you interpret it when it comes out.
The HDI was conceived by the economists Mahbub ul Haq and Amartya Sen in 1990, as a response to the more commonly used (at the time) Gross Domestic Product (GDP), which Sen described as ”a very crude indicator of the economic achievements of a nation” .
The HDI is also a single number, which contains information more relevant to quality of life than GDP ever managed to. Whereas GDP measures human development in terms of the market value of goods and services bought and sold, the HDI also considers the impact of lower mortality, better health, and more school education on societal wellbeing.
The UNDP defines the HDI as
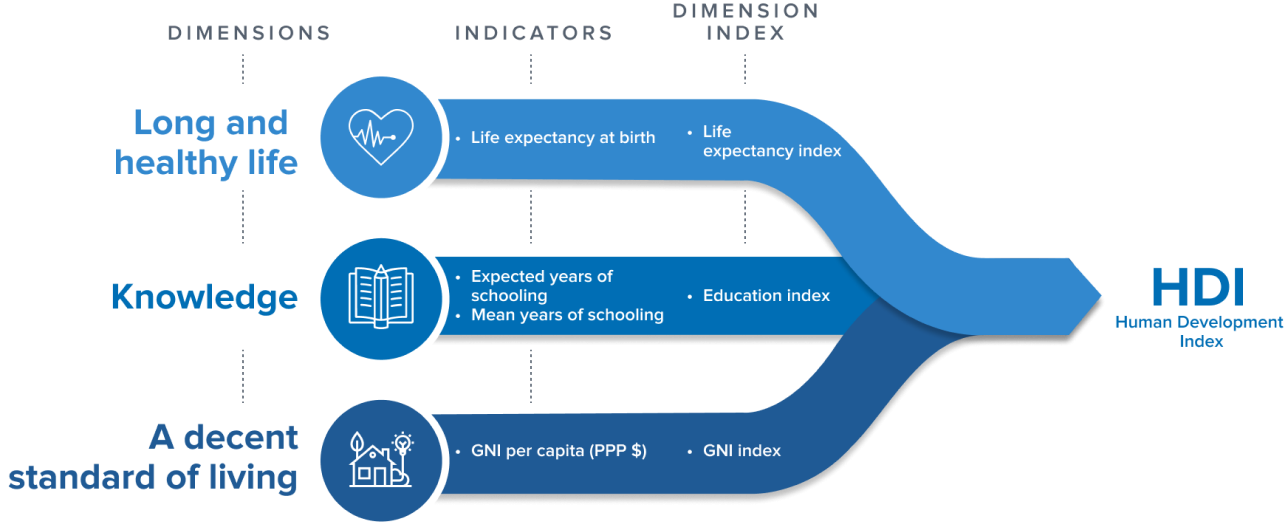
“a composite index measuring average achievement in three basic dimensions of human development — a long and healthy life, knowledge and a decent standard of living” .
.png)
Each dimension of the HDI uses one or more indicators to calculate dimensional indices (see Figure 1, above).
- A Long and healthy life is indicated by life expectancy at birth — the number of years a newborn infant could expect to live.
- Knowledge is indicated by a combination of expected years of schooling — the number of years of schooling that a child of school entrance age can expect to receive — and mean years of schooling — the average number of years of education received by people ages 25 and older.
- ‘A decent standard of living’ is indicated by GNI per capita — the annual Gross National Income per person, converted to 2017 international dollars using Purchasing Power Parity (PPP) rates.
How is the HDI calculated?
There are two key steps to calculating the HDI of countries:
- Creating the dimensional indices from the indicators mentioned above.
- Aggregating these dimensional indices to produce the Human Development Index.
Creating the Dimensional Indices
Since indicators are expressed in different units (i.e., years and 2017 PPP $), so-called ‘goalposts’ have to be set in order to transform them to indices between 0 and 1. The highest possible value a country can receive for its HDI is 1. These ‘goalposts’ are taken as the minimum and maximum values per indicator for that year (see Table 1, below).

The UNDP justifies these minimum and maximum values as follows:
- A minimum life expectancy of 20 years is based on historical evidence that no country in the 20th century has had a life expectancy of less than 20 years.
- A maximum life expectancy of 85 years is said to be a realistic aspirational target for many countries over the last 30 years.
- The minimum of 0 years for expected years of schooling and mean years of schooling is based on the fact that societies can subsist without formal education.
- The maximum of 18 years for expected years of schooling is equivalent to achieving a master’s degree in most countries.
- The maximum of 15 years for mean years of schooling is the projected maximum of this indicator for 2025.
- The minimum of $100 per capita is based on the considerable amount of unmeasured subsistence and non-market production in economies close to this minimum.
- The maximum of $75,000 per capita is based on there being virtually no gain in human development and well-being from an annual income per capita above $75,000.
Using these minimum and maximum values, the dimensional indices are calculated using the equation below.

The Life Expectancy Index (ILife Expectancy) is calculated using Equation (1) as is.
For the Education Index (IEducation), the Equation (1) is first applied to each of the two indicators (i.e., Expected and Mean Years of Schooling), and then the arithmetic mean of the two resulting indices is taken.
According to UNDP, each additional dollar of income has a smaller effect on expanding capabilities. For this reason, the natural logarithm (ln) of the actual, minimum, and maximum values is used when calculating the GNI Index (IGNI).
Aggregating the dimensional indices to produce the HDI
The HDI is then calculated as the geometric mean of the three dimensional indices using Equation (2), below:

Using South Africa as an example (see Table 2, below), it is possible to calculate the three dimensional indices, as well as the resulting HDI (refer to equations below):

Using Equation (1):

Figure 2, below, shows the change over time (from 2010 - 2019) for South Africa’s HDI (orange) and the respective composite indices.
%20-%20South%20Africa.png)
Data from 1990 to 2019, for other African countries, can be accessed here.
This is the first in a series of articles about the Human Development Index, produced around the launch of the 2022 report on 8 September. Check back next week for part two.


