-p-1080.jpg)

All over the world, governments publish statistical information online, much of it in Portable Document Format (PDF) documents. PDF documents are useful because they preserve elaborate formatting that makes it easier to read and understand them. This format, however, is not very conducive to processing data for analysis.
PDF documents which contain tables of data can be read by human eyes. However, despite being digital, they are not machine-readable. Machine-readable documents can be read and automatically processed by a computer without human intervention, and include formats such as CSV (Comma Separated Values), JSON (JavaScript Object Notation) and XML (Extensible Mark-up Language). These formats allow computers to read tables and process them as tables, making it easier to analyse and disseminate data. According to the World Bank, many African countries are yet to provide data in machine-readable format.
If you are a journalist working under tight deadlines, you may often need to read particular sections or tables in a PDF report quickly, and the ability to search a report using a particular phrase or keyword is a big time-saver. PDF documents can be searched using Adobe’s Search tool or a browser’s Find tool if they are text-based, which is to say they are created from “printing to PDF” from a text-based document.
However, if they are image-based, they cannot be searched. This means you may have to read through an entire document to find a particular figure, which is time-consuming.
Journalists working with statistics often look to analyse and plot graphs with data contained in reports. However, copying and pasting data from tables in PDF reports, particularly from large tables, is repetitive and may lead to errors. This tutorial aims to help journalists who need an easy method to extract large tables accurately from PDF documents. It will illustrate how to use Tabula to extract Table 3 from the Kenya Demographic and Health Survey 2022 Key Indicators Report. Table 3 is reproduced below.
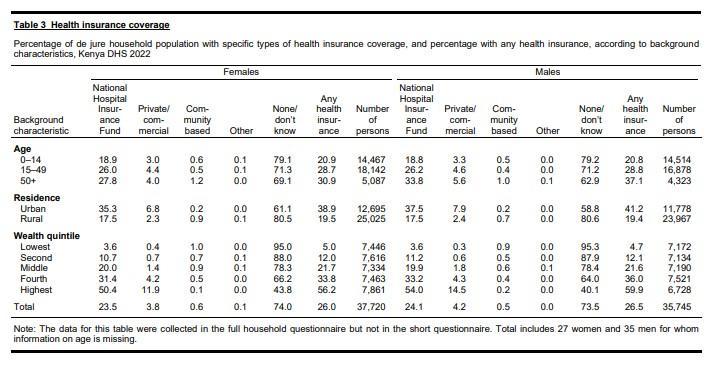
Figure 1: Table 3 from the Kenya Demographic and Health Survey 2022 Key Indicators Report.
Installing Tabula
First ensure you have Java installed on your computer. Then log on to the Tabula website and install Tabula. The installation process is similar whether your computer is a PC or a Mac. Download the appropriate installer for your operating system, for example tabula-win-1.2.1.zip for Windows or tabula-mac-1.2.1.zip for a Mac.
If you have experience issues with the application you can use Tabula on your web browser.
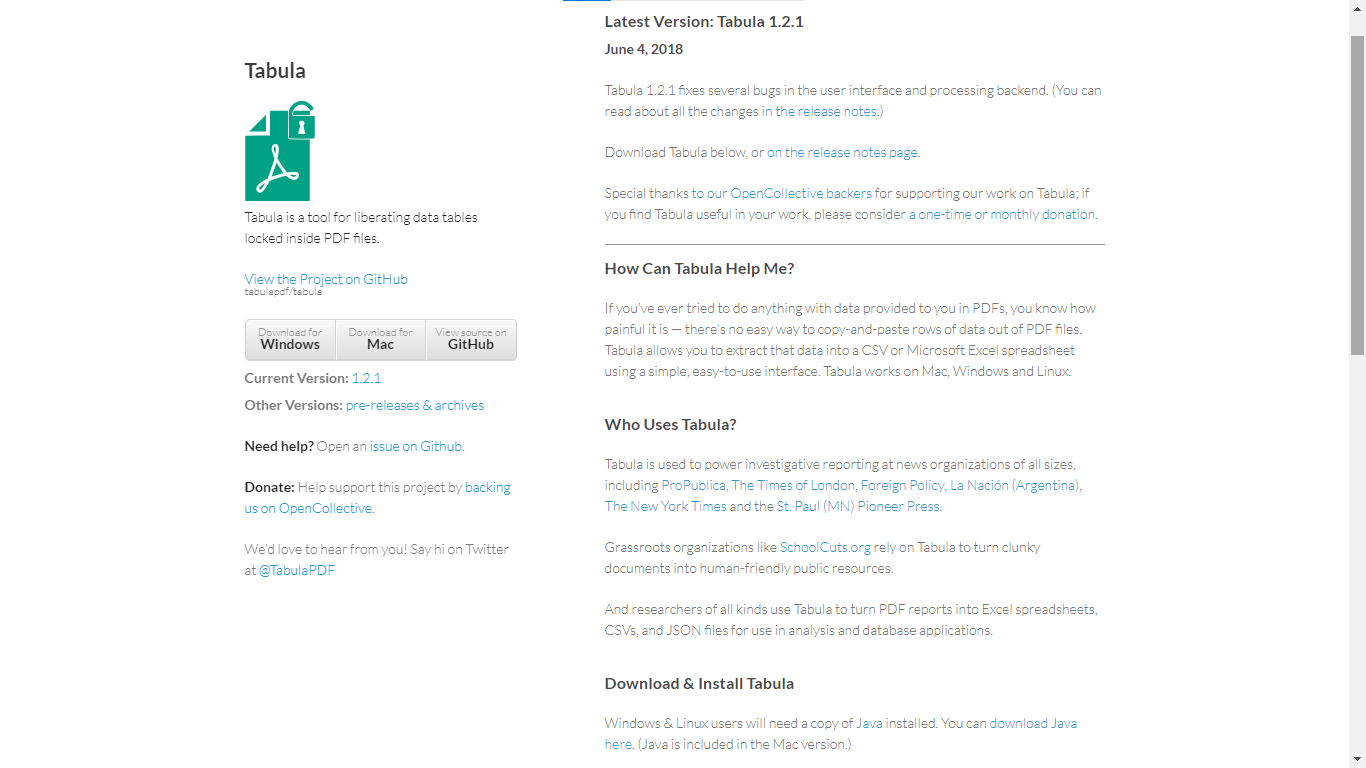
Figure 2: A screenshot from the Tabula website.
If you install Tabula successfully, you should see a Tabula folder with the green “tabula.exe” file icon as below. In this case, the Tabula folder is found in the Downloads folder (look for the same icon on a Mac). Click on the green icon to start Tabula. You should see a black window with the information below.
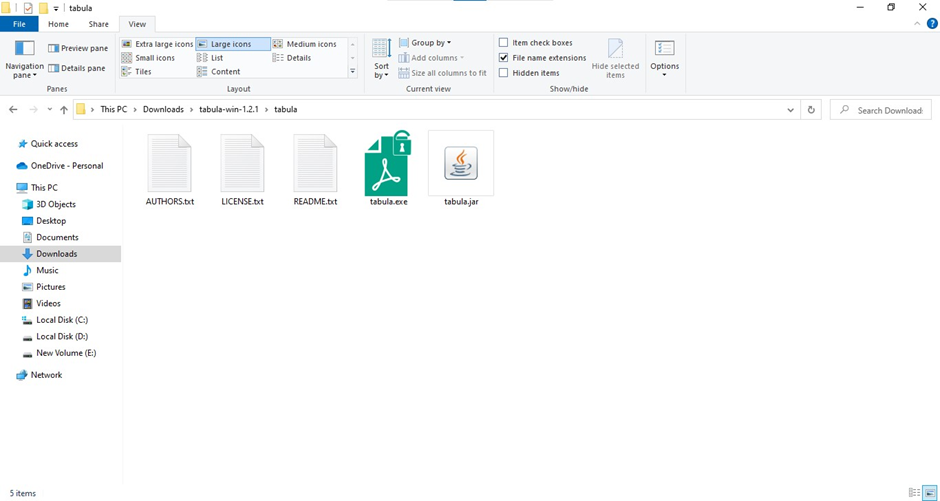
Figure 3: A Windows screenshot showing Tabula icon after the tool is successfully installed.
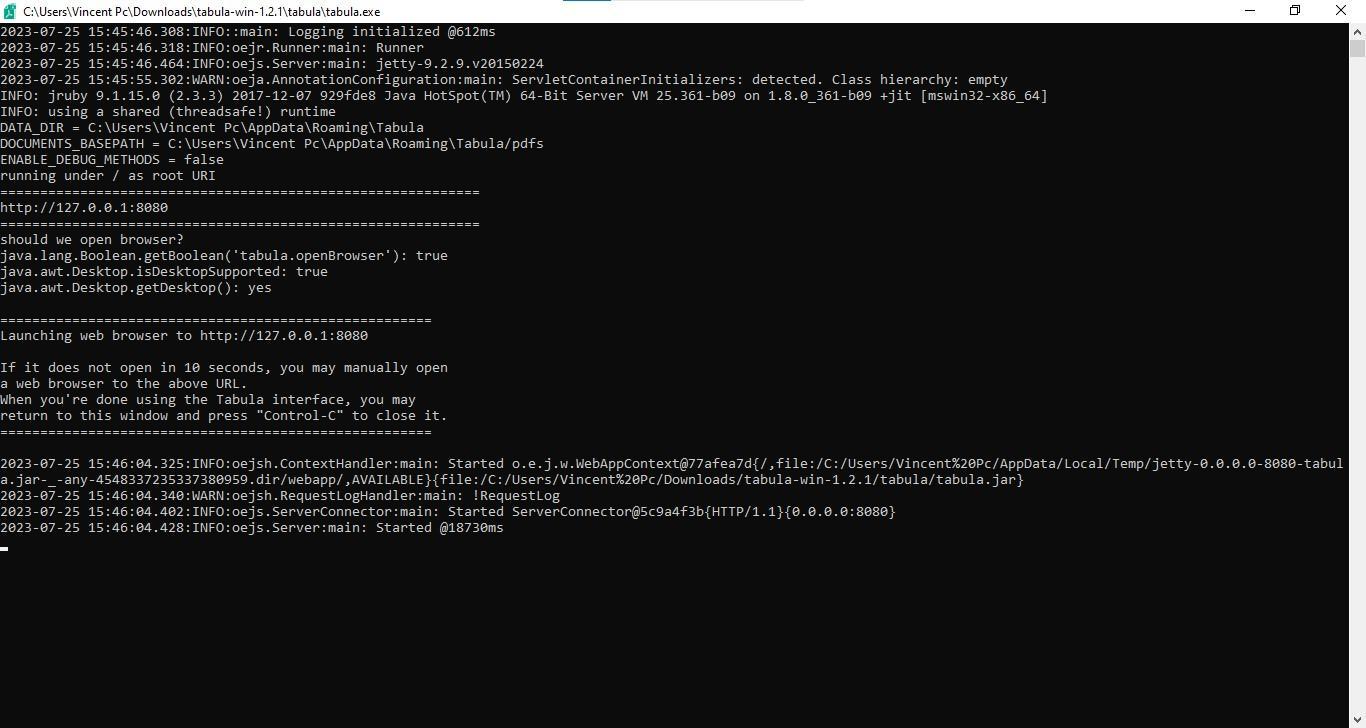
Figure 4: Window that opens following successful start-up of Tabula
Tabula will open in a new window, and you will be prompted to import one or more PDF documents. Press the Browse… button to find the document you wish to extract data from and upload it to Tabula. In the window below, you can see that the Kenya Demographic and Health Survey 2022 Key Indicators Report PDF document has been successfully uploaded.

Figure 5: Tabula ready for data extraction, with the 2022 Kenya Demographic and Health Survey Key Indicators Report successfully uploaded.
Uploading your PDF Document
Press the

Extract Data button to open the document in Tabula. You should see the document open with a preview pane on the left and a

Preview and Export Extracted Data button on the right, as in Figure 6 below. You are now ready to extract data.
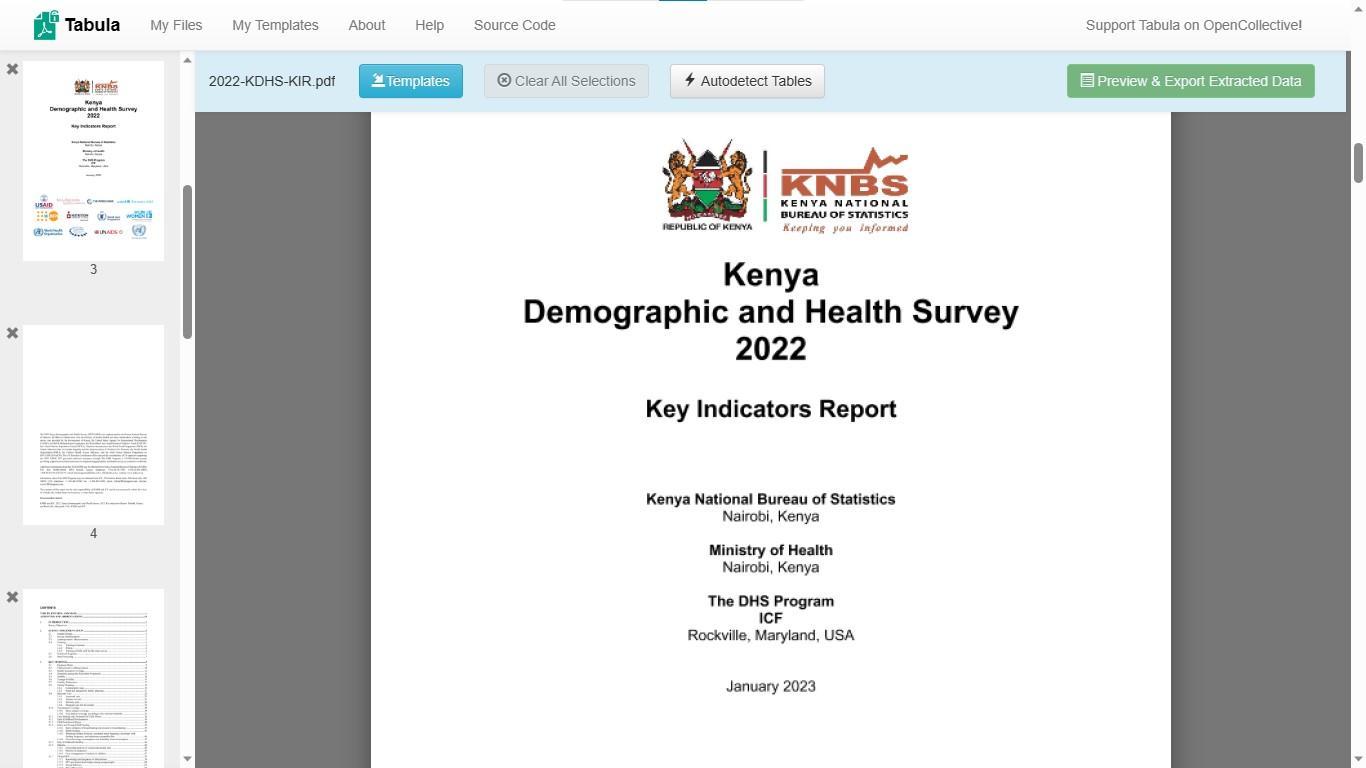
Figure 6: Tabula showing the 2022 Kenya Demographic and Health Survey Key Indicators Report successfully uploaded
Extracting Tables
Before extracting data, you need to identify the full extent of the table(s) you intend to extract. In the preview window, you will see an Autodetect Tables

button that highlights all the tables in your document. While the tool may highlight the presence of a table in red, as shown below, it does not automatically detect the full extent of every table. So it’s good practice to visually inspect the document and determine the full extent of each table before extracting data. In Figure 7 below, the full table is not highlighted, particularly the first column from the right and the footnotes.
So the first task is to cover the full extent of the table as shown in Figure 8.
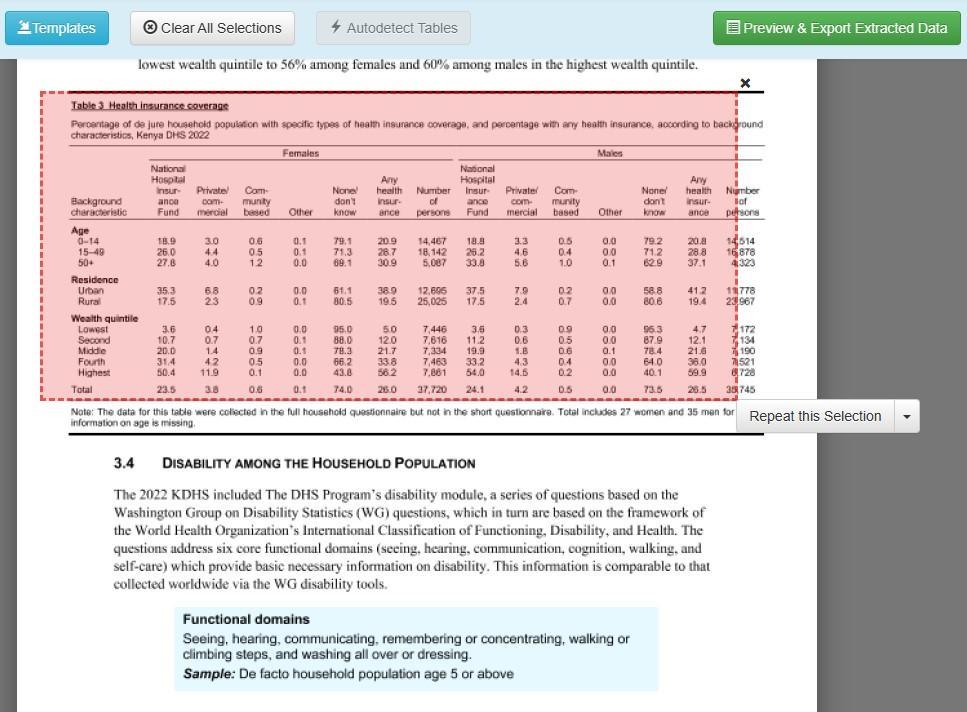
Figure 7: Table 3 in Tabula after using the Autodetect Tables feature. Note the red boundary does not trace the full extent of the table.
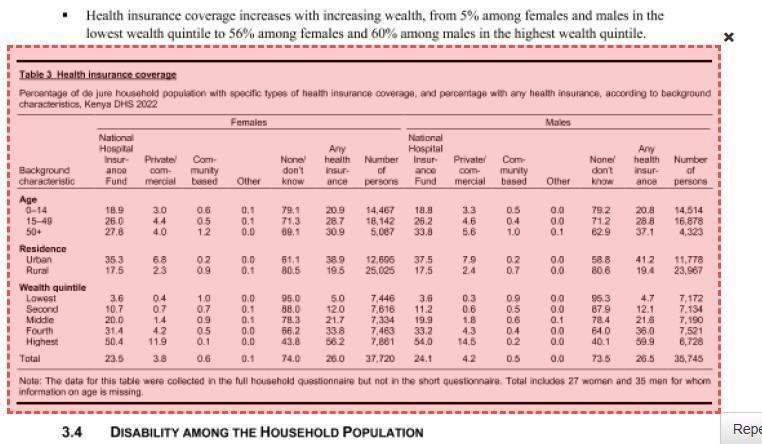
Figure 8: Table 3 in Tabula showing full extent of Table 3 selected by user.
Previewing the data shows how it would be displayed if it were extracted. We will extract Table 3 in CSV (Comma Separated Values) format using Microsoft Excel. (Note: Tabula can extract it in five formats: CSV, TSV, JSON (dimensions), JSON (data), zip of CSVs or Script).
As Figure 9 shows, the preview of extracted data contains significant distortion of columns in both the headings and data. This is obviously not the intended result of the extraction process.
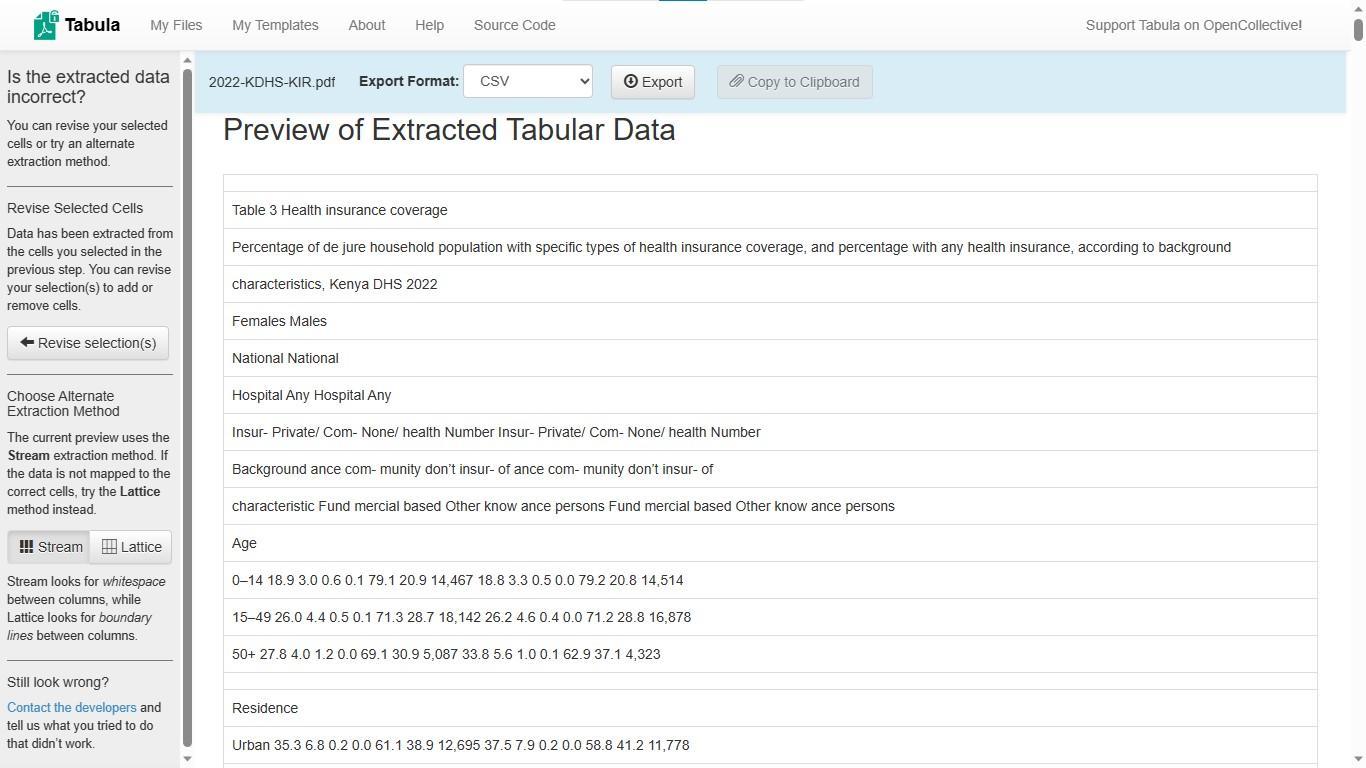
Figure 9: Tabula preview of extracted data showing distortion of column headers and column data. This happens when an entire table, including headers and footers is extracted in a single operation. Splitting the table allows extraction of rows and columns without distortion.
To correct this distortion, select the

Revise Selection(s) button and select individual sections of the table where figures are formatted in the same way, as below. Notice that in Figure 10, all the columns which were distorted in the Figure 9 preview are now accurately produced.
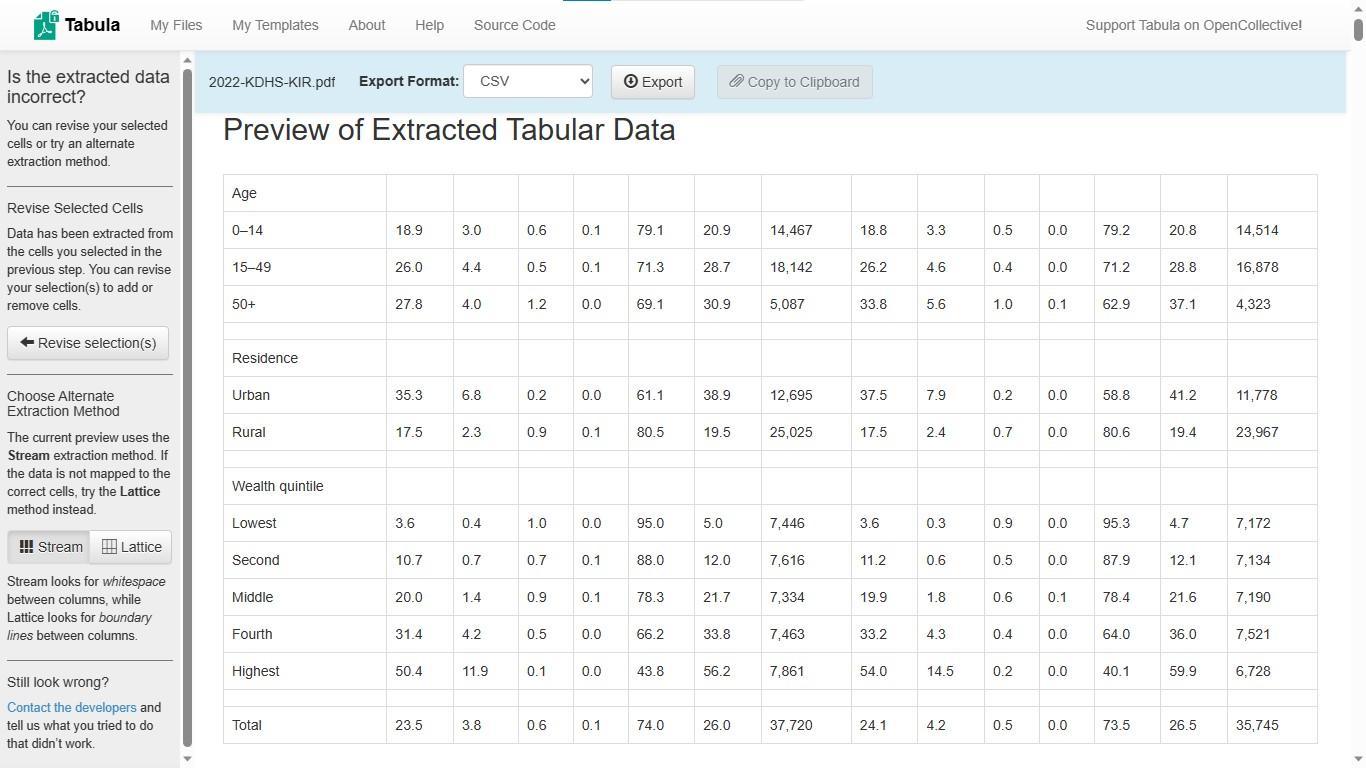
Figure 10: Extracting only rows and columns with numeric data and no headers or footers gives better results.
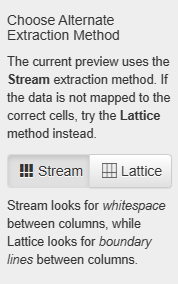
If the data does not appear to be correctly extracted, switch between the Stream and Lattice extraction methods until you are satisfied (see Figure 11). Then select “CSV” as your export format and click Export.
Upon successful export, a CSV file will be created in Microsoft Excel and will appear as Figure 12 below. The extraction process is not flawless, however since the CSV file may have distortions that require correction. For example, Column A, which shows Age data, has characters that are not immediately distinguishable, as shown in the red rectangle. Cell A2 contains the value 0–14 and Cell A3 contains the value 15–49. We will remove these distortions at the Data Cleaning stage.
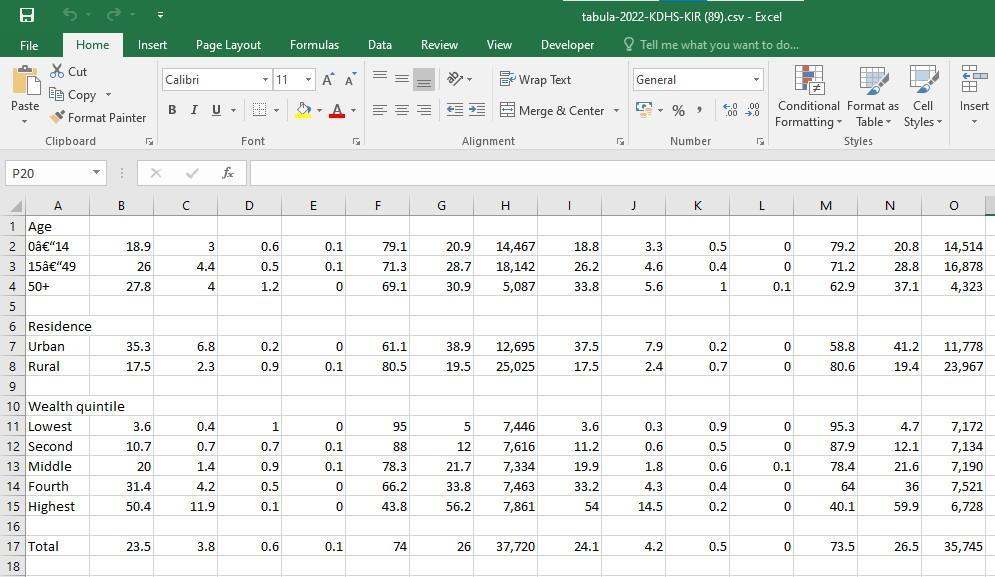
Figure 12: Extracted rows and columns in CSV file. Note the distorted characters highlighted by the red rectangle.
Tabula breaks up headers and footers by splitting wrapped text headers into individual rows. For example, the headers of Table 3 in Figure 13 are extracted as shown in Figure 14, below. You can avoid this distortion by copying the headers directly from the PDF document into the CSV file created by Tabula.
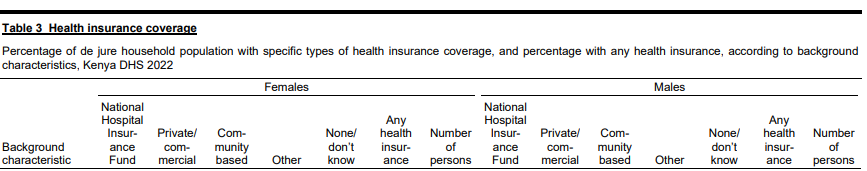
Figure 13: Extract from Table 3 showing original headers in the PDF document.

Figure 14: Tabula preview showing distorted headers. Headers and footers can be copied directly from the PDF document to your CSV file for more accuracy.
The CSV file in Figure 15 below shows the table with the headers and footers manually copied. At this point the table is ready for cleaning, verification and formatting.
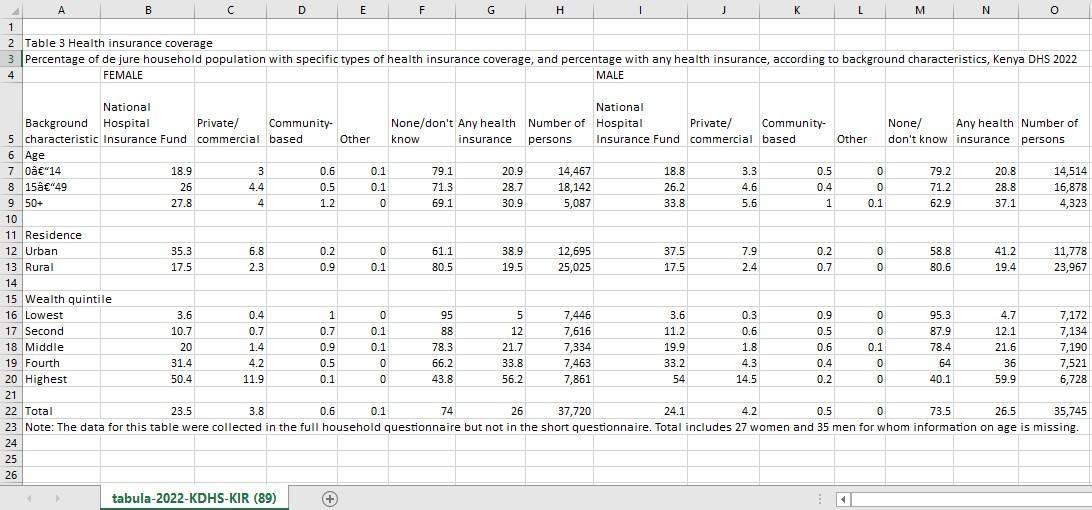
Figure 15: CSV file with headers and footers manually copied. This provides more accurate results than extracting headers
Data Cleaning
You can find numerous guides to cleaning data. The term generally refers to removing faulty data before analysis. It also includes checking for duplicates and missing data. Cleaning ensures that all the data matches the attributes that would be logically expected for a certain dataset. For example, in a survey, all percentages should be equal to or less than one hundred and the sample sizes should not be more than than the total number of respondents in the study or category in question, be it men, women, urban residents or rural residents.
Earlier in Figure 12, we saw that two rows under the Age section in Table 3 had data that was unclear. As you can see in Figure 10, the distortion does not appear in the Tabula preview, but in the CSV file. One of the creators of Tabula, Jeremy Merrill, also emailed to confirm to us that this was true. As Figure 16 shows, comparing the extracted table to the original in the PDF document shows the extracted version contains the characters – where an em dash (–) ought to be. Now is the time to replace the – characters with the em dash.

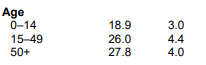
Figure 16: Extract from CSV file on the left, showing distorted characters and extract from the original PDF file on the right showing the correct characters.
Verification
Verification involves comparing extracted data to the original data to ensure it has been extracted accurately. Every extracted number should be compared to the original. For large datasets, totals can be verified by adding up the extracted numbers and ensuring extracted totals match those in the original PDF document.
Formatting
Use Microsoft Excel to format the extracted CSV file like the original PDF document. For best results, pay keen attention to font styles, text wrapping and merging cells. Cells containing survey values and not headers, footers or row and column labels should be formatted as numbers. In addition, a look at the original PDF document shows that all percentages are rounded to one decimal place, including where the value of that decimal place is zero and the same should be done on the CSV file. The final extracted table should appear as in Figure 17 below.
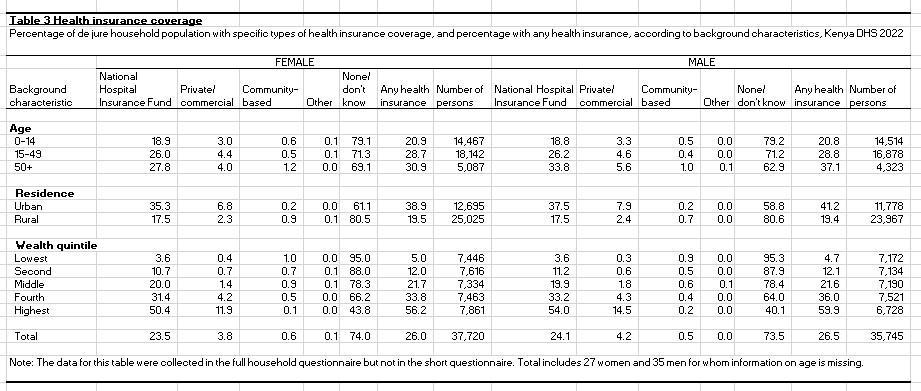
Figure 17: The final accurate extracted table.
You now know how to accurately extract a data table from a PDF document into a CSV file using Tabula. With this tool, you can now free lots of data trapped in documents, analyse, and spread it far and wide. Happy extracting!
Photo by Towfiqu barbhuiya on Unsplash